What Is Dollar-Cost Averaging? How Investing a Fixed Amount on a Schedule Works
Dollar-cost averaging is an investing method in which a person puts a fixed amount of money into the same investment at a fixed interval, such as $300 every month, without regard to the price. The fixed amount buys more shares when the price is low and fewer shares when the price is high.
Benjamin Graham named the method in The Intelligent Investor in 1949, and most workplace retirement contributions have run on it ever since. Vanguard's research finds that investing an available lump sum all at once has beaten it roughly two-thirds of the time.
Key takeaways
- Dollar-cost averaging invests a fixed amount at a fixed interval, which places the average cost per share at or below the average price over the same period.
- Benjamin Graham described the method in The Intelligent Investor in 1949 as investing "in common stocks the same number of dollars each month or each quarter."
- Vanguard compared the two approaches across major markets from 1976 to 2022 and found that investing a lump sum immediately won between 61.6% and 73.7% of the time.
- Dollar-cost averaging lowers the average purchase price. It leaves the investor fully exposed to a fall in the asset itself.
How does dollar-cost averaging work?
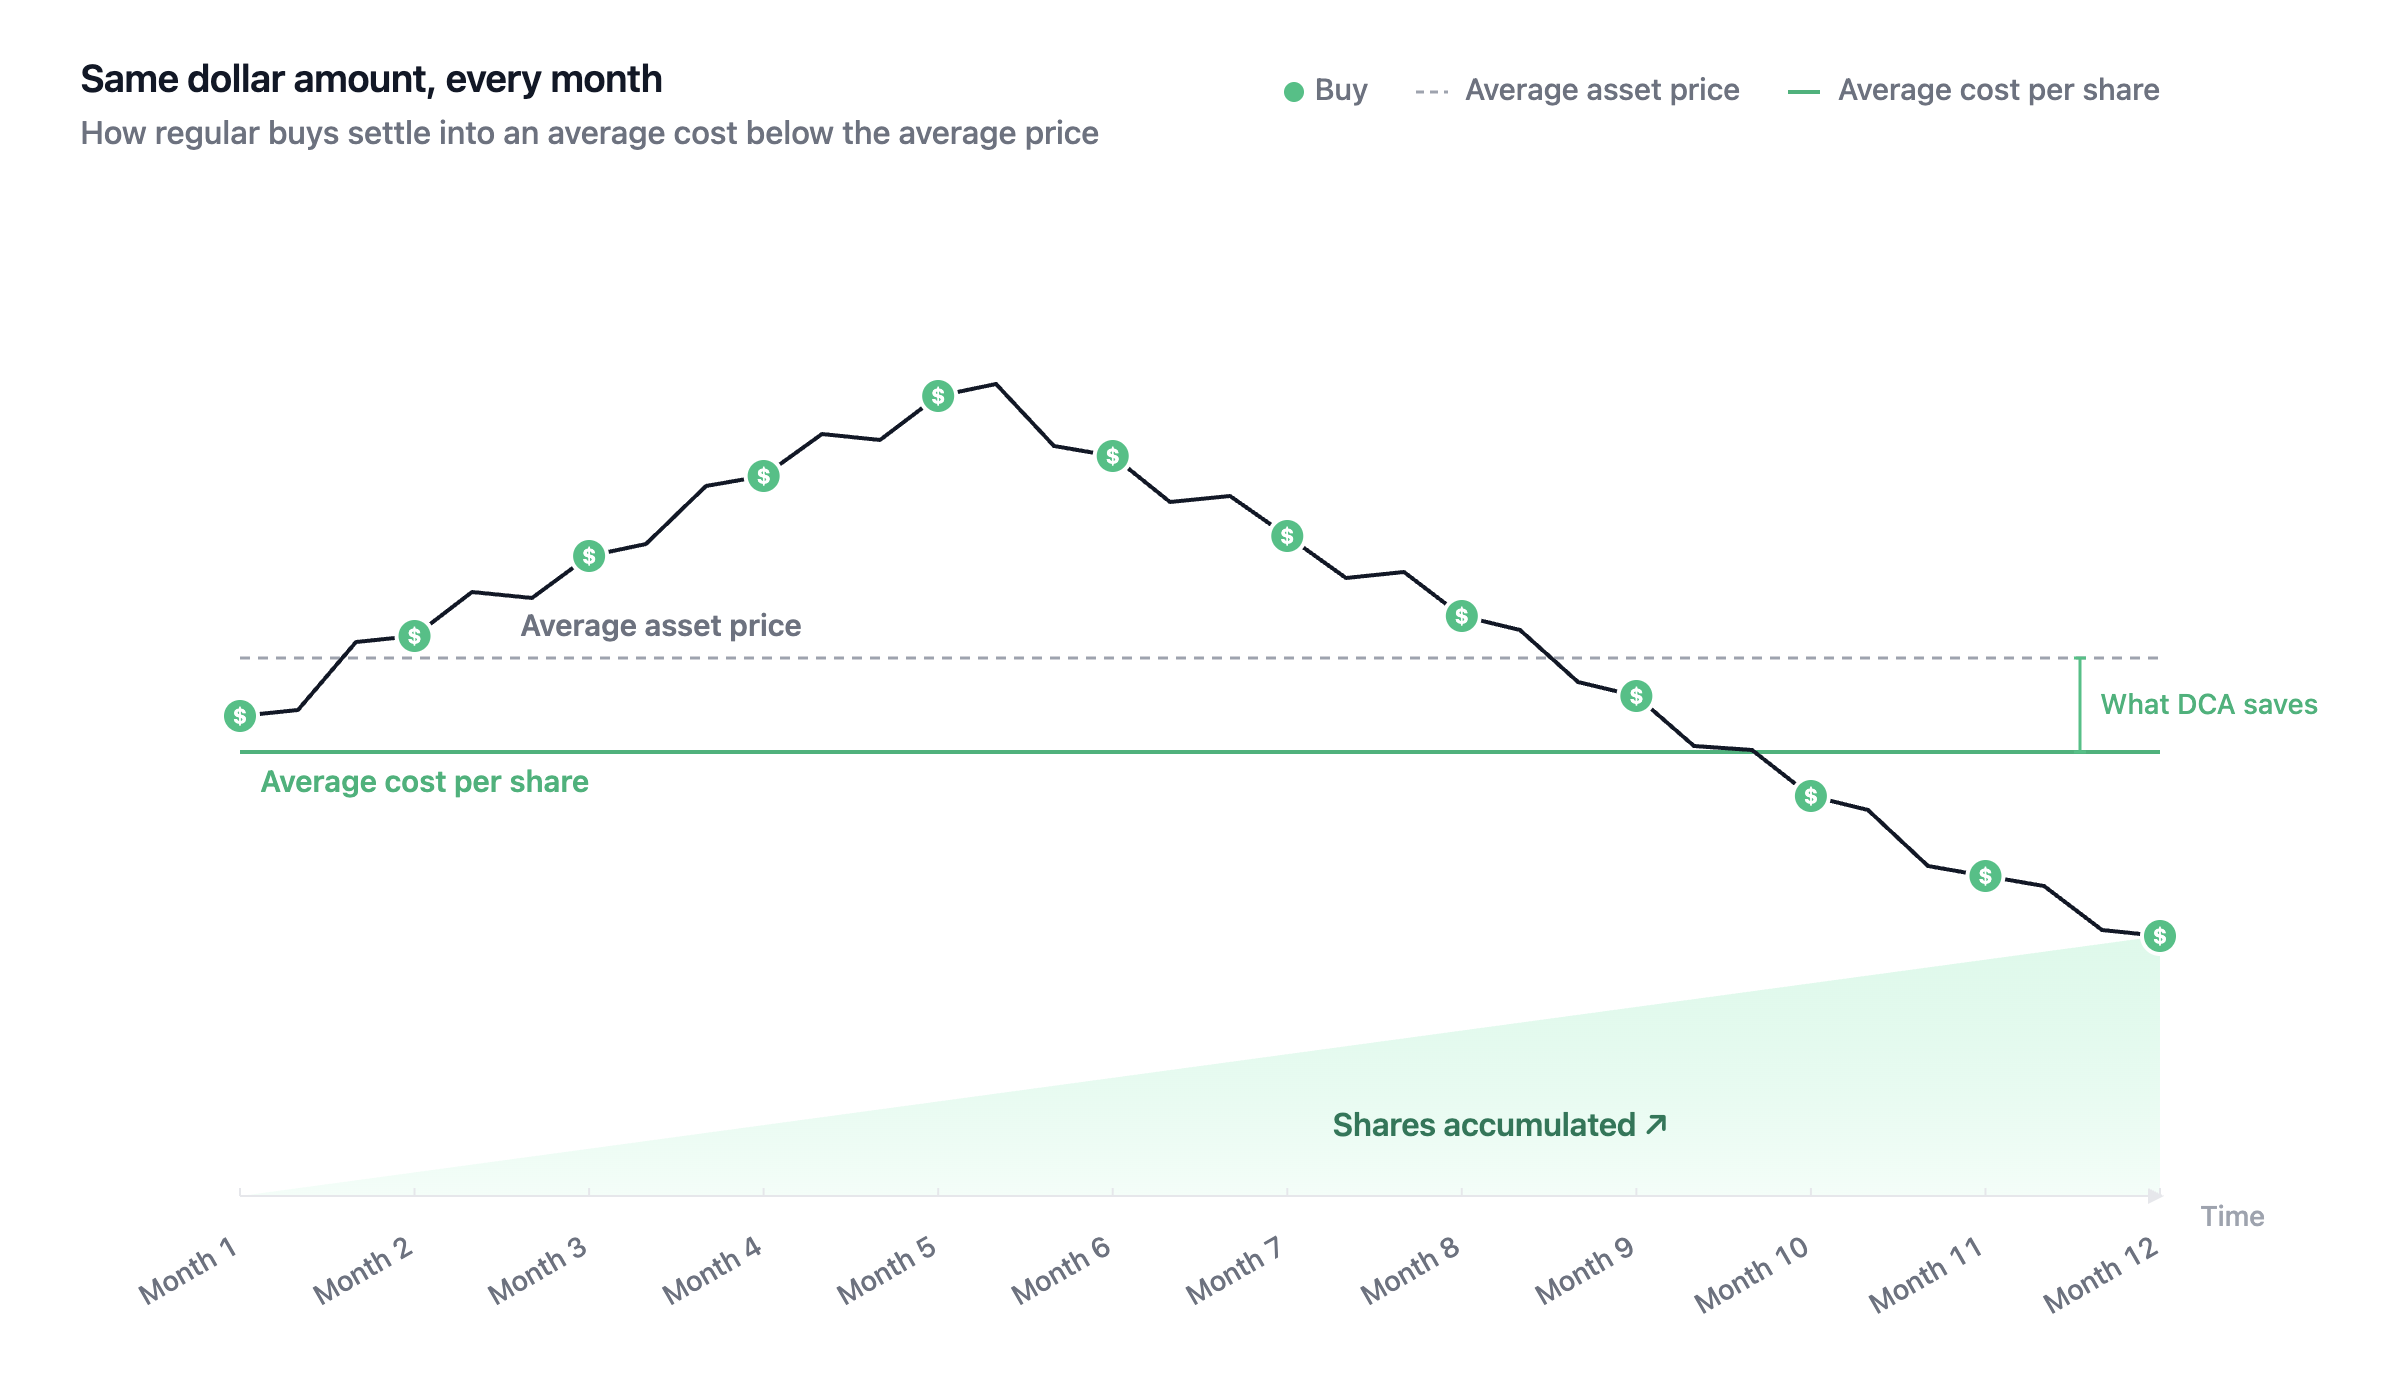
A person picks an amount, an interval, and an investment, then buys that amount at that interval regardless of price. Because the amount is fixed and the price moves, the number of shares bought changes every time. Low prices buy more shares, high prices buy fewer, and no decision is made on any individual purchase.
The arithmetic follows from that. Averaging the prices paid gives one number; dividing total money spent by total shares owned gives a different, lower number, because more of the money went in at the cheaper prices. The gap between the two widens as the price swings more.
Most people already invest this way without calling it that. A payroll deduction into a pension or retirement plan fixes the amount and the interval in advance, and buys on schedule whatever the market did that month.
What does dollar-cost averaging look like in numbers?
Investing $300 a month for six months while a share price falls from $100 to $50 produces an average cost of $80 a share against an average price of $92.50, a gap of $12.50, or 13.5% below the average price. The reason is that the two cheapest months bought 11 of the 22.5 shares.
| Month | Share price | Amount invested | Shares bought |
|---|---|---|---|
| 1 | $100 | $300 | 3 |
| 2 | $150 | $300 | 2 |
| 3 | $120 | $300 | 2.5 |
| 4 | $75 | $300 | 4 |
| 5 | $60 | $300 | 5 |
| 6 | $50 | $300 | 6 |
| Total | Average price $92.50 | $1,800 | 22.5 shares, average cost $80 |
The same $1,800 spent in month one at $100 would have bought 18 shares. At the month-six price of $50, the scheduled buyer holds $1,125 and the month-one buyer holds $900. Both are down on the money they put in, because the price halved. A lower average cost reduces the size of that loss while leaving its direction unchanged.
Is a lump sum better than dollar-cost averaging?
Investing an available lump sum immediately has outperformed spreading it out about two-thirds of the time. Vanguard tested one-year rolling periods across major markets from 1976 to 2022 and measured a lump-sum win rate between 61.6% and 73.7%, depending on the market. Over that same span, US stocks beat cash 76% of the time and bonds beat cash 68% of the time.
The size of the difference tracks how much of the portfolio sits in stocks. Over a one-year window, an all-equity portfolio invested at once ended a median 2.2% higher than the same money spread over three months, against 1.8% for a 60/40 mix and 1.2% for a 40/60 mix. In the worst 5% of outcomes the ranking flips, and spreading the money out ended 3.6% ahead.
Vanguard draws a line most summaries of its work leave out. The finding applies to a windfall already sitting in cash: an inheritance, a bonus, a business sale. It says nothing about investing part of each paycheck, because that money goes in as soon as it exists and no cash is held back.
What are the drawbacks of dollar-cost averaging?
The main cost is time spent in cash. Money waiting for its scheduled turn earns a cash rate rather than the asset's return, and from 1976 to 2022 that trade went against the saver about two-thirds of the time. The longer the schedule runs, the larger the cost.
The method also does nothing about the asset's own risk. A fixed schedule into an investment that falls 50% still leaves the holder down 50% on the shares bought at the start.
The behavioral case is weaker than it is usually presented. Morningstar's Mind the Gap 2025 study found that the average dollar in US funds earned 7.0% a year over the decade to 31 December 2024, against those funds' own 8.2% return. That shortfall was narrowest, at 0.8 percentage points, among funds whose money flowed in most steadily, and widest, at 1.8 points, among those traded most. Morningstar adds that regular contributions can open part of the gap on their own, and a 2026 Financial Analysts Journal paper attributes only 0.10 percentage points a year to mistimed trades.
How does someone set up dollar-cost averaging?
Three decisions cover it: the amount, the interval, and whether the buy happens automatically. The amount should survive a bad month, since a schedule abandoned in the first downturn delivers none of the effect. Weekly, two-weekly, and monthly intervals give similar results over long horizons, so the interval that matches when income arrives is the practical choice.
Automation is the part that decides whether the schedule survives contact with a busy month. A recurring instruction executes without a decision each time, which is the mechanism behind auto investing apps and behind scheduled portfolio rebalancing. Buying onchain adds one consideration a brokerage does not have: network fees are charged per transaction rather than per dollar, so very small, very frequent buys can lose a meaningful share of each purchase unless the app absorbs those fees.
Glider supports recurring buys by asset, amount, and cadence, and covers the network fees on each one, with the assets held in the user's own account rather than the company's. The same schedule can point at cryptocurrencies, tokenized gold, or tokenized US stocks, which are available to non-US persons only.
Dollar-cost averaging is a fixed amount invested at a fixed interval, which produces an average cost per share at or below the average price over that period. Vanguard's data shows a lump sum already in hand usually doing better, by a median 1.2% to 2.2% over a year depending on the stock allocation. That comparison does not apply to money invested from income as it is earned, which is how most people invest.
FAQ
Does dollar-cost averaging actually work?
The cost arithmetic holds in every case, because dividing total money spent by total shares bought always gives an average cost at or below the average price over that period. Whether the final balance beats investing everything at once is a separate question, and Vanguard's data says it usually does not.
How often should someone dollar-cost average?
Weekly, two-weekly, and monthly schedules produce similar outcomes over long horizons, so the interval that lines up with income is the practical choice. Shorter intervals smooth price swings slightly more. Onchain, they also mean more transactions and therefore more network fees, unless the app covers them.
Is dollar-cost averaging good for crypto?
The arithmetic is identical for any asset whose price moves, and larger swings widen the gap between average cost and average price. The method leaves the asset's own risk untouched. A scheduled buyer of something that falls 70% is down 70% on the shares bought before the fall.
What is the difference between dollar-cost averaging and lump-sum investing?
Lump-sum investing puts available cash into the market in one transaction. Dollar-cost averaging spreads that same cash across several purchases over weeks or months. Vanguard measured lump-sum investing ahead between 61.6% and 73.7% of the time across major markets from 1976 to 2022.
This article is for educational purposes only. It does not constitute financial, legal, or tax advice, or a solicitation to buy or sell any asset. The value of investments can fall as well as rise. Readers should do their own research and consider their own circumstances before making any financial decision.