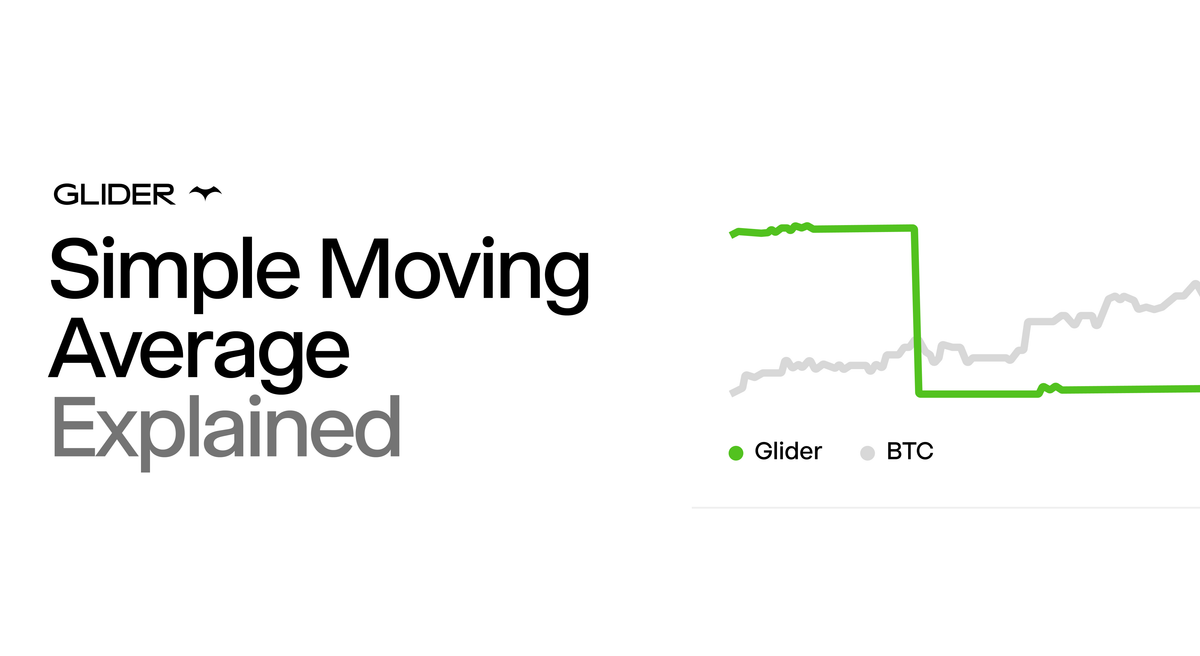
How to Use SMA (Simple Moving Average) in Your Glider Portfolio
Markets move fast. The hardest part of investing isn’t pressing buy, it’s knowing when to hold and when to step aside. That’s where the Simple Moving Average (SMA) comes in.
What is SMA?
A Simple Moving Average is just the average price of a token over a period of time. On Glider, we use the 9-day SMA, meaning it looks at the average price over the last nine days.
Why does this matter? Because the SMA shows you the trend.
- Price above the SMA → bullish strength
- Price below the SMA → bearish weakness
Why it matters
Look at Ethereum as an example.
Every time ETH’s price broke above its SMA, the trend pushed upward until the next reversal. And when price fell below the SMA, the trend kept sliding down. The SMA helps you catch those shifts early.
Building with Glider
In Glider’s portfolio editor, you can apply the SMA directly with an If/Else block:
- If price is above SMA → buy the token
- If price is below SMA → sell into your chosen pair (like USDC)
That’s it. You’ve just built a dynamic strategy that follows the trend — without needing to sit in front of charts every day.
Learn More
We put together a short tutorial to walk you through how SMA works and how to use it inside Glider.
Have questions or want a walkthrough? Join our Discord or follow us on X @glider_fi.
Disclaimer: This guide is strictly for educational purposes only and doesn’t constitute financial or legal advice or a solicitation to buy or sell any assets or to make any financial decisions. Please be careful and do your own research.